What is Circos
Circos visualizes data in a circular layout. Here it is used to visualize the reference vs. draft genome comparison. It is especially useful to visualize genomic rearrangements and large INDELs. This tool is visualizing the comparison information from the previous step Draft vs. Reference genome comparison. The position based data is presented in a circular way, which projects the specific regions in the draft genome to the mapped reference genome region.
What to input
- Reference genome in FASTA format
- Target genome (new assembly or other genome you want to compare) in FASTA format
Output example
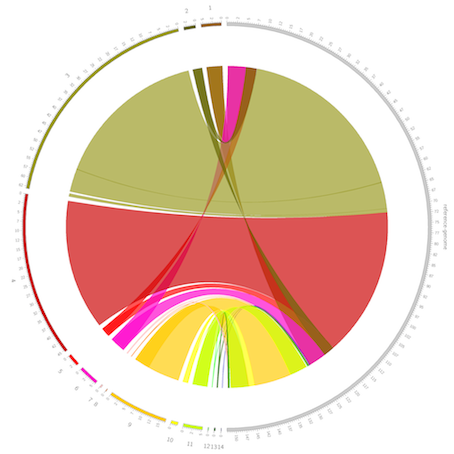
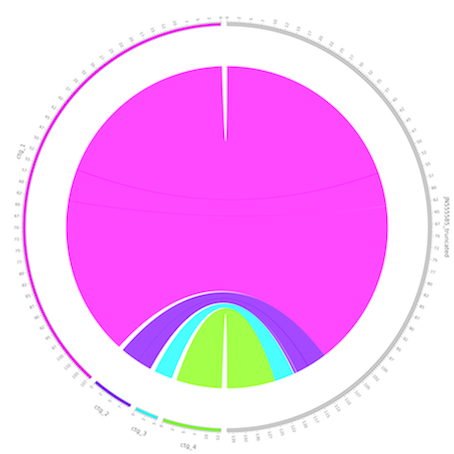
The grey segment on the right side represents the reference genome, and the colored segments on the left represent the contigs from the target genome. The unit of the axis is kb. The semi-transparant bands inside the circle connect the aligned fragments between the target genome and the reference genome.
Reference
Krzywinski, M. et al. Circos: an Information Aesthetic for Comparative Genomics. Genome Res (2009) 19:1639-1645